


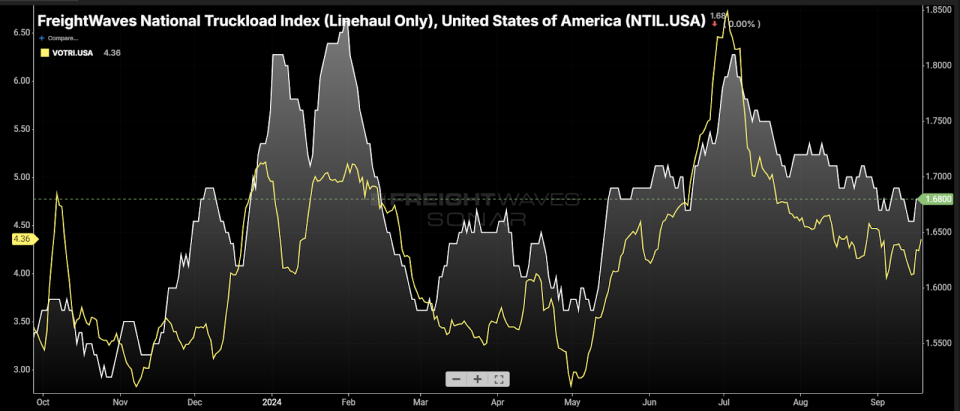
Chart of the Week: National Truckload Index (Linehaul Only), Van Outbound Tender Rejection Index – USA SONAR: NTIL.USA, VOTRI.USA
Spot rates excluding the total estimated cost of fuel (NTIL) have fallen 3% since the start of August. Dry van tender rejection rates (VOTRI), which measure the percentage of loads that carriers are unable to cover for their customers, are averaging about 30 basis points lower. In other words, the market that appeared to be showing signs of tightening in the summer has reversed course over the past quarter.
For those less familiar with the U.S. freight market, spot rates generally increase when it is more challenging to find a truck to cover freight and decrease when it is easier. The spot market is the Wild West of the trucking market. It represents the most extreme levels of volatility and the polarized edges of the industry.
Spot rates are very useful in looking at near-term trends but lose value when looking over the course of multiple years due to inflation and mixing. Operating costs for carriers have increased more than 30% over the past five years, putting invisible upward pressure on rates. Unfortunately for many carriers, they have not been able to pass along much of these costs due to an extremely competitive environment. A flood of new entrants during the pandemic era is largely to blame.

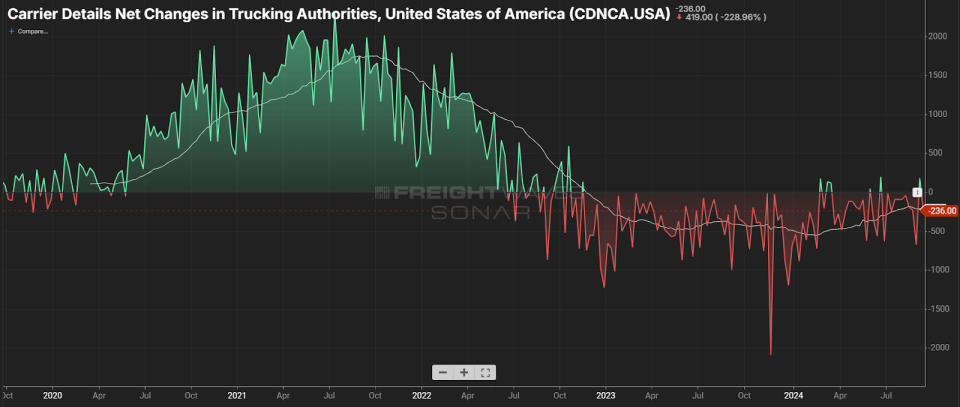
Carrier details analysis of net changes in Federal Motor Carrier Safety Administration active operating authorities shows there was record growth of 50% in newly registered carrier of property operating authorities from 2020 into the middle of 2022. This rate of growth quadrupled the rate that occurred in the market from 2018-19. The result of that was also a strong prolonged market downturn, resulting in numerous carrier exits.
The pandemic demand bubble has been bursting for over two and a half years for the domestic transportation market. More than 200 carriers per week are leaving the space net of entrants. The gross majority of these exits are small fleets and owner-operators consisting of fewer than five trucks and most with less than three years of experience.
So far, the deterioration in capacity has only resulted in a few short-lived periods of slight market vulnerability.

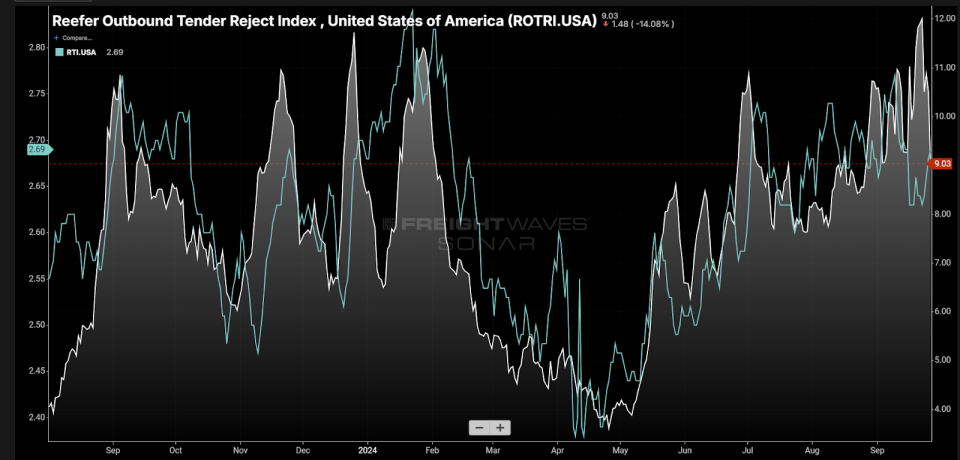
Last year’s refrigerated (reefer) trucking market was the first to show signs of tightening. Spot (RTI) and rejection rates (ROTRI) jumped in front of Labor Day and rode a roller coaster into January before falling back to record lows. The reefer market has since recovered in a more sustainable manner but has stumbled over the past week.

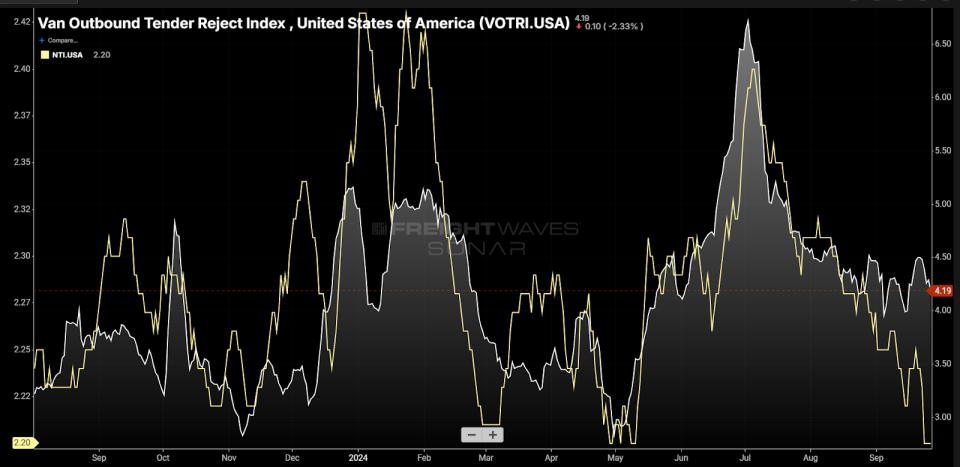
The dry van market, which represents the bulk of the for-hire trucking market activity, also has had a few moments. The polar plunge of arctic air in January pushed spot and rejection rates back to Christmas levels as shippers were stalled for a few days.
Over the summer, spot and rejection rates spiked as an unexpected inflow of imports hit the West Coast, putting a strain on carrier networks. There was sufficient slack in capacity to recover, however, and now the market is trending softer after showing increasing signs of vulnerability.
Hurricanes and strikes
Hurricane Helene landed as a major Category 4 storm, with much of its impact on infrastructure hitting the inland markets in the Southeast.

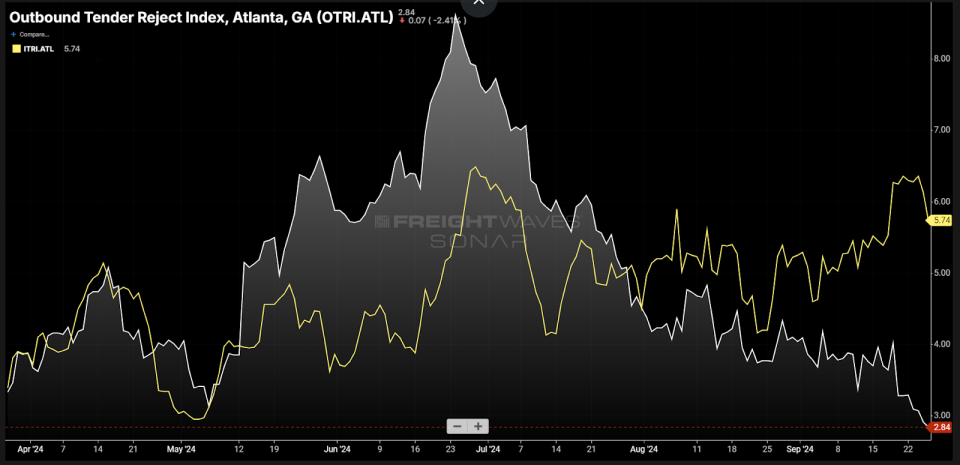
Atlanta’s outbound rejection rates plummeted in front of the storm, while inbound rejection rates jumped. This could lead to some level of short-lived disruption but probably not a market breaker like Harvey was in 2017.
The International Longshoremen’s Association strike also has some potential depending on whether it occurs and for how long, but many shippers have been preparing for this for several months now.
Is this the new normal?
The possible good news for transportation service providers is that while the spot market has collapsed and many of the disruptive events have faded in the near term, rejection rates are still trending higher over the course of a year. The likelihood of a sustained market turn this fall has faded, but that does not remove the possibility of a strong shift in 2025.
Capacity exits at its fastest pace over the winter. If this trend continues and the market stays soft through the holidays, the likelihood of a severe supply shock increases substantially.
Definitively, this market is not sustainable. It will shift. The fact that capacity continues to exit at record levels tells you that supply is diving toward demand on the curve. The timing is always the most challenging thing to predict and the shift will probably occur when many have lowered their guard.
And who can blame them, as this has been the longest, most severe freight recession in modern times.
About the Chart of the Week
The FreightWaves Chart of the Week is a chart selection from SONAR that provides an interesting data point to describe the state of the freight markets. A chart is chosen from thousands of potential charts on SONAR to help participants visualize the freight market in real time. Each week a Market Expert will post a chart, along with commentary, live on the front page. After that, the Chart of the Week will be archived on FreightWaves.com for future reference.
SONAR aggregates data from hundreds of sources, presenting the data in charts and maps and providing commentary on what freight market experts want to know about the industry in real time.
The FreightWaves data science and product teams are releasing new datasets each week and enhancing the client experience.
To request a SONAR demo, click here.
The post Freight market green shoots fade heading into October appeared first on FreightWaves.
Read the full article here


 Closes at Record High on Tame Inflation Data")
 Chips")

 Is Still a Long-Term Winner, No Matter the Noise")