Most Read: Fed Keeps Rates Steady, Grows Cautious on Inflation; Gold, USD, Yields Await Powell
The U.S. dollar, as measured by the DXY index, sank more than 0.6% on Wednesday, pressured by falling U.S. yields in the wake of the Federal Reserve’s monetary policy decision. For context, the U.S. central bank left borrowing costs unchanged in their current range of 5.25% to 5.50% and retained its previous forward guidance despite rising inflation risks.
Regarding the quantitative tightening program, the Fed announced it would significantly curtail the scheme by which it is shrinking the size of its portfolio of assets. Starting next month, the amount of Treasuries allowed to roll off the balance sheet when they mature will be cut from $60 billion to $25 billion. This came as a surprise, with many bond dealers expecting a smaller taper.
Focusing on the policy statement, the document added a hawkish acknowledgment of the “lack of further progress” on disinflation, but Chair Powell’s subsequent press conference struck a more dovish tone. Many traders initially believed that the FOMC chief would come out swinging after the string of unfavorable CPI, PPI and core PCE readings in 2024, but he failed to embrace a more aggressive stance.
Want to know where the U.S. dollar may be headed over the coming months? Explore key insights in our second-quarter forecast. Request your free trading guide now!
Recommended by Diego Colman
Get Your Free USD Forecast
While Powell did highlight a high threshold for easing and noted that it would probably take longer than initially envisioned to pivot to a looser stance, he made it sound like the bar for resuming hiking borrowing costs is even higher. Some traders, who had been predicting that rates might rise again, were caught on the wrong side of the trade after this assessment.
With the Fed failing to embrace a hawkish posture at its last gathering, government bond yields will struggle to extend their recent rally, removing a bullish catalyst from the U.S. dollar. This does not mean that interest rates will start correcting lower imminently, but rather that their upside potential may be limited going forward.
Against this backdrop, the U.S. dollar could trade sideways or with a slightly negative bias in the near term, although its prospects will also depend on the relative stance of other key central banks, such as the ECB and the Bank of England.
For an extensive analysis of the euro’s medium-term prospects, download our complimentary Q2 forecast
Recommended by Diego Colman
Get Your Free EUR Forecast
EUR/USD FORECAST – TECHNICAL ANALYSIS
EUR/USD rallied on Wednesday, edging closer to reclaiming overhead resistance at 1.0725. Bears must staunchly defend this ceiling to thwart the momentum from picking up; a failure to do so might trigger an advance towards 1.0755. With continued strength, the focus will shift to the 1.0800 mark.
In the event of a market retracement, support is projected to emerge close to the 1.0700 mark, followed by this week’s swing low near 1.0645. Looking further down, April’s trough near the 1.0600 psychological threshold will be the next area of interest for the bearish camp.
EUR/USD PRICE ACTION CHART
EUR/USD Chart Created Using TradingView
Wondering about GBP/USD’s medium-term prospects? Gain clarity with our latest forecast. Download it now!
Recommended by Diego Colman
Get Your Free GBP Forecast
GBP/USD FORECAST – TECHNICAL ANALYSIS
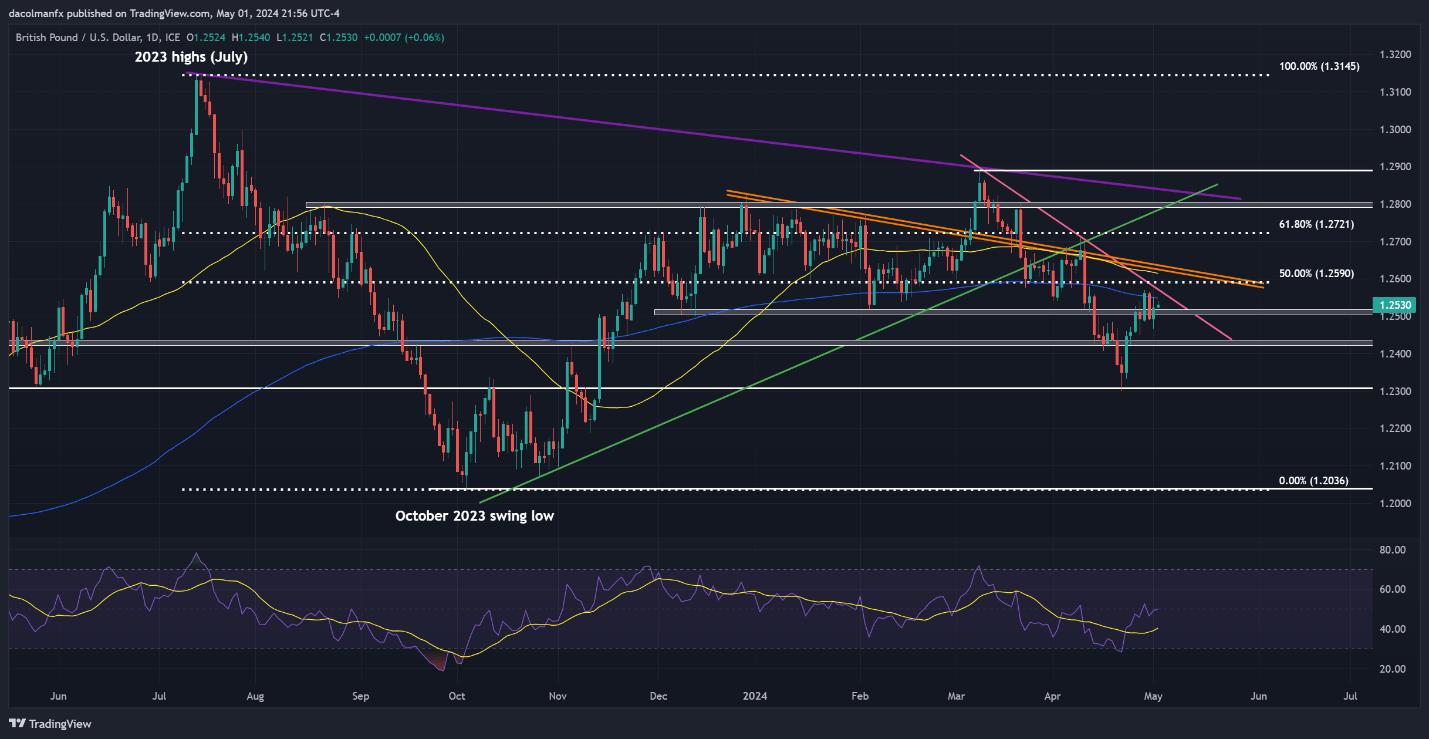
GBP/USD gained ground on Wednesday, pushing past 1.2515 but falling short of clearing trendline resistance and the 200-day simple moving average at 1.2550. Traders should watch this technical zone closely, keeping in mind that a breakout could result in a rally towards a Fib ceiling at 1.2590.
On the flip side, if sentiment shifts in favor of sellers and prices head back below 1.2515/1.2500, support is expected to materialize around 1.2430. To stave off a more pronounced selloff, bulls must tenaciously protect this floor; any lapse could precipitate a swift market downturn towards 1.2305.
GBP/USD PRICE ACTION CHART

GBP/USD Chart Created Using TradingView
Read the full article here


