Even though Friday’s monthly jobs report was mixed, more jobs than expected but revisions to last month’s data it was enough to reassure the stock market bulls. The dollar was hit hard as most traders are now looking for a quarter-point rate cut by June. The consensus analysis from the jobs report did not alter that view.
As expected from the technical review early last week, bond yields were lower last week. Both the 10 and 30-year yields have already hit our initial downside targets. They are now oversold short term so yields could rebound heading into Tuesday’s inflation report.
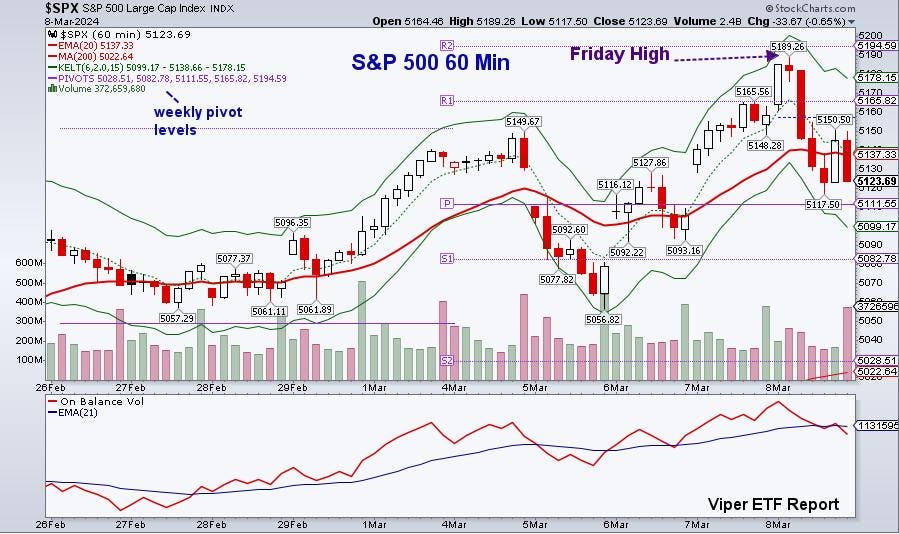
The stock market’s reaction to the jobs report was telegraphed before the open as the E-mini S&P futures made their high at 5193 just after 9:00 AM ET and almost 30 minutes before the open in New York.
The 60 min chart of the S&P 500 shows the spike higher after the open as it made its high at 5189.26 which was very close to the weekly R2 at 5189.26. Those who follow the pivot point analysis know that this happens quite often. Pivot point analysis has often been discussed on Forbes.com and on YouTube.
By Friday afternoon, the S&P 500 had traded down to 5117.50 which was close to the weekly pivot at 5111.55. The daily charts of the Ihe Invesco QQQ
QQQ
SMH
On July 27th, 2023 the SPX made its intraday high at 4607 before closing at 4537. This was below the prior day’s low (see chart). From my self taught technical analysis I learned this was a key reversal. It was not until several years later in 1989 when on a speaking trip to Japan that I was given a copy of The Japanese chart of charts from my colleagues at Barings Bank. This book started the spread candlestick charting to the Western world.
Now this formation is more often referred to as a bearish engulfing pattern that forms over two bars and often but not always indicates a major change in sentiment. The Invesco QQQ Trust (QQQ) made a new high Friday at $448.64 but then closed at $439.02 which was below Thursday’s low at $440.86. The volume was the heaviest since last October.
The VanEck Vectors Semiconductor (SMH) also opened higher and made a new high at $239.14 before closing at $224.99. This was well below the Thursday low of $229.46. SMH did exceed the monthly R2 at $231.76 and the daily starc+ band at $235.34. It closed 6% above its 20-day EMA which means it still has more room for a further decline.
The reversal in SMH was due in part to the key reversal in NVIDIA
NVDA
DIA
This will likely make some holders of NVDA nervous next week. There is next support in the $828.80 to $800 area with the rising 20-day EMA at $792. I doubt if it is a major top but it may be weeks or even longer before Friday’s high is exceeded. It would likely take a major development that questions the viablilty for AI to indicate a major top. The daily RS, OBV, and DTS are still positive.
What about the overall market? After the July 27th reversal the S&P stayed above its 20-day EMA for five days. By August 10th all of the daily A/D lines had turned negative which indicated the market was then in the corrective mode.
The current technical outlook for the stock market is positive though many of the averages have been extended on the upside. The daily chart of SPY
PY
SPY
As a sign of a broader market rally the NYSE Stocks Only A/D line broke through resistance, now support at line c, in late February. It also made a new high last week as did the NYSE All A/D line which has important support at line e. If we get a few days of very strong selling and very one-sided A/D numbers it could drop the A/D lines below their EMAs.
Instead of an overall market correction like what followed the July key reversal a sector rotation may be more likely.. The multi-timeframe DTS analysis of the ETFs has given positive signals for some of the lagging value sectors in past month. Be sure to use stops on all your positions and if you have large open profits, taking some profits is always a good idea.
Read the full article here


